From shopping to banking to traveling, technology saves us a lot of time. For tax professionals on the job, technology automates key functions like gathering, transforming, and organizing data. The resulting time savings can be used for value-added activities like ANALYTICS—a must for knowing your best tax position.
Analytics dashboards aren’t just for the C-suite. Tax preparers and directors need useful insights, too. They’re all looking for dashboards and KPIs to tell a story and help them understand their data at a glance.
Whether analytics are new or familiar to you, CSC Corptax® Office and Point of View (POV) make it easy to produce dashboards with amazing speed and efficiency. The secret? The ability to directly access and display the exact data you need from your own Point of View!
Let’s look at a few popular dashboards you can create with Corptax Office and POV to instantly analyze and communicate information.
Build charts, tables, and maps in minutes
Using spreadsheets to figure out what’s affecting the ETR requires sifting through huge amounts of data. Not ideal when management wants solid information yesterday.
With Corptax, you can directly access the right data at the right level for KPIs and dashboards to show impacts to taxable income, tax expense, and the ETR. Plus, you can quickly communicate what’s affecting the ETR by taxable income, expense, or PTBI. And it’s just as simple to see how countries are impacted by changes and to identify trends based on prior years. (See Figure 1)

Figure 1: Quickly analyze your ETR by group, entity, or country. Additionally, look at trends focusing on ETR, total expense, and book income based on easy-to-digest dashboards.
Corptax stores your tax data with the granularity you need to produce dashboards that explain what’s behind your rate drivers. So when you’re preparing your provision, you can see and focus on items impacting your ETR. Also, by visualizing data for federal or state reporting, you can spot anomalies faster. (See Figures 2 and 3)

Figure 2: How do you get to your total ETR? This dashboard walks us from the statutory rate to the ETR. By displaying items with the largest impact first, it’s easy to identify the largest rate drivers. We can also display ETR by group. Want to see the ETR by a different property in Corptax? That’s easily configurable with direct access to your data.
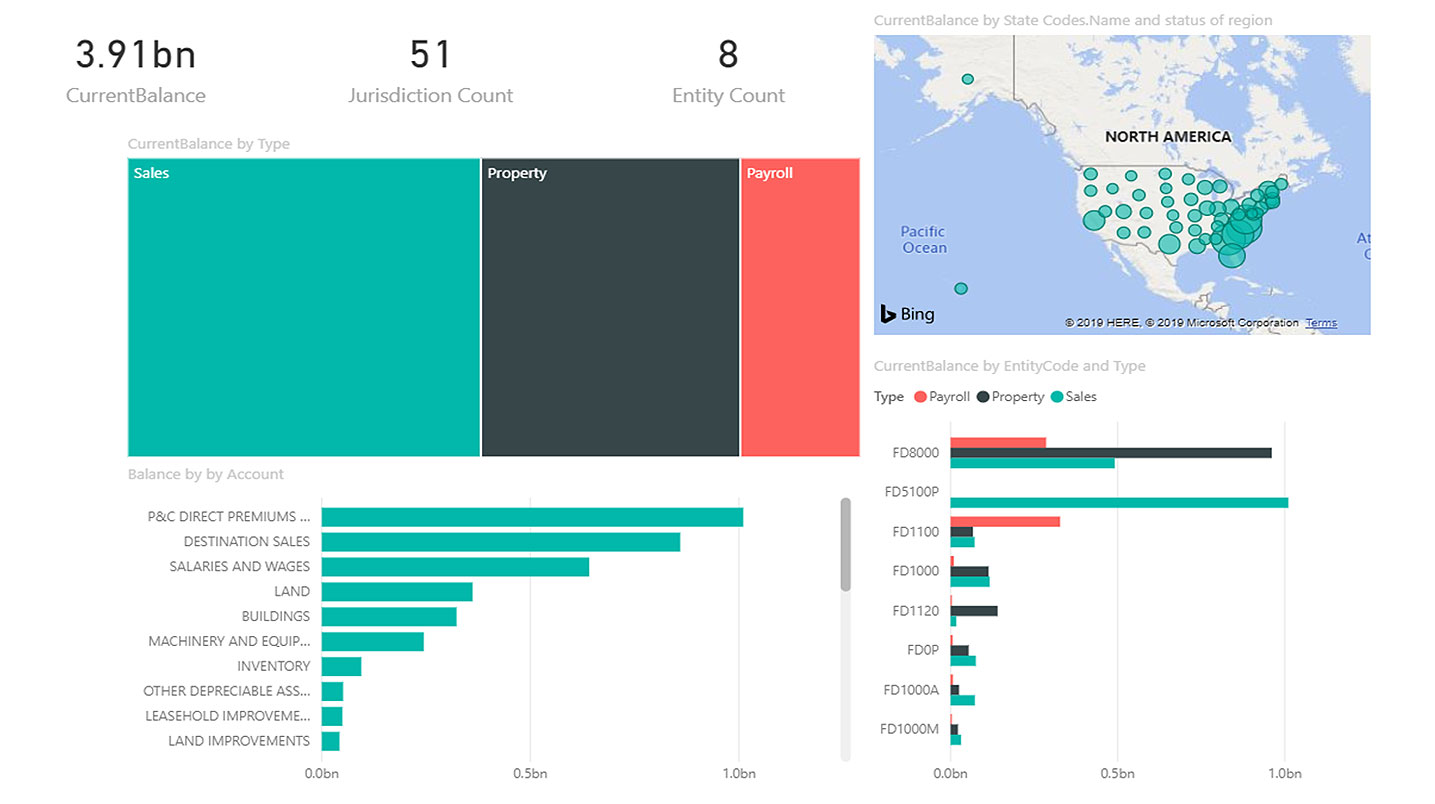
Figure 3: When it comes to state compliance, the amount of data can be overwhelming. This dashboard slices and dices apportionment data to help you quickly identify and deal with abnormalities.
Using Corptax Office and Point of View to directly access data for dashboards makes short work of visualizing information to support your strategies and end results. Give it a try!
Need help getting started? Check out free, pre-built templates included with Corptax Office. Whether you use a template out of the box or as a starting point for something bigger, we offer several models to assist with visualizing your tax data. Take advantage of the CSC Corptax® Professional Services team—we have experience designing and building visualizations across many third-party software programs.
Looking for a direct, refreshable connection to analytics programs from Corptax? Visit the Tax Transformation Suite for further information.
About Eric Ziemann
A Senior Manager on the Corptax Professional Services team, Eric focuses on tax data metrics and analytics solutions to help customers uncover valuable insights.